Note: This article was written in 2014. While the content remains relevant, it may not reflect all of the latest scientific research and regulations. Please check our extensive news coverage for updates or ask our Chatbot to summarize the latest related information.
1. Introduction
People are exposed to hundreds of chemicals every day. More than 85,000 chemicals are used in consumer products (Goldman and Koduru 2000) and more than 6,000 chemicals are known to be used in food contact materials (Oldring et al. 2013). If exposure is not adequately controlled, chemicals may cause harm to exposed populations. Health effects can range from mild eye irritation and nausea to serious chronic disease like cancer. In order to control chemical exposure, chemical risk assessments are carried out. Chemical risk assessment is the quantification of the risk for health damage occurring in a population due to chemical exposure. The basic approach to quantifying risk follows the following formula:
RISK = EXPOSURE x HAZARD
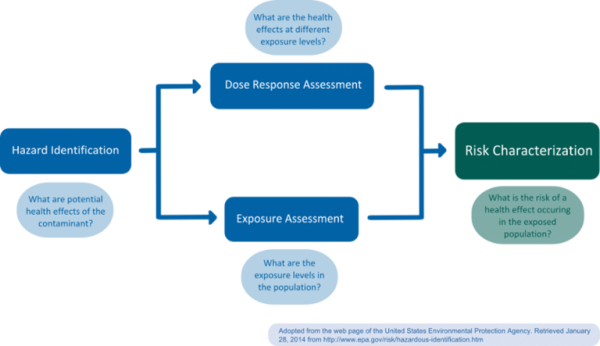
Risk assessment should be clearly distinguished from risk management, which is a normative process carried out by regulators; in risk management, socio-economic or political considerations are taken into account and weighed against risk estimates. Subsequently, necessary control and prevention measures are initiated. Generally, risk assessment is considered a science-based process consisting of four steps: a) Hazard identification, b) dose-response assessment (or: hazard quantification, hazard characterization), c) exposure assessment, and d) risk assessment (or: risk characterization) (Figure 1) (NRC 1983).
2. Risk assessment process
Hazard identification
During hazard identification, the potential hazard posed by a chemical is identified. Typical information required for identification of hazardous chemicals includes data on toxicokinetics (absorption, distribution, metabolism and elimination (ADME)) and the interaction of a chemical with a biological target (toxicodynamics, f.e. Quantitative Structure-Activity Relationships (QSARs)) (EPA 2014). Alternative sources of information are accidents and measured residue levels in biota (van Leeuwen and Vermeire 2007).
Dose-response assessment
The goal of dose-response assessment is to describe the relationship between different degrees of exposure (dose) to a substance identified as a potential hazard, and incidence and severity of an effect on the organism, usually focusing on the most sensitive endpoint (van Leeuwen and Vermeire 2007). Dose-response assessments are usually based on toxicological in vivo studies, though in vitro, in silico, or epidemiological studies may also be employed. In vivo studies for regulatory risk assessment are usually carried out in accordance with guidelines established by the Organisation for Economic Co-operation and Development (OECD), following good laboratory practice (GLP). As a result of the dose-response assessment, a tolerable daily intake (TDI or Reference Dose (RfD) in the U.S.) for the human population of interest is established. For non-carcinogens, the TDI or RfD corresponds to an exposure level at which no adverse health effect would be expected (safe dose). To extrapolate from the animal study to the human population, the no-observed (adverse) effect level (NOEL or NOAEL, level where no effect was observed in an animal study) is usually divided by a safety factor of 100 (van Leeuwen and Vermeire 2007). In cases were a NOEL is not available, statistical lower bounds such as the Benchmark Dose Level (BMDL) may be employed to estimate safe dose levels (Crump 2003). For non-threshold compounds, such as genotoxic carcinogens, the TDI or RfD refers to an acceptable risk level, which is usually set at 1/1,000,000. Usually, the lower 95% confidence level is used as a point of departure for extrapolation; extrapolation may be founded on the mode-of-action or be linear (EPA 2005).
Exposure assessment
During the exposure assessment, exposure levels found or, in the case of not yet marketed chemicals, anticipated to occur in the population are estimated. For this purpose, biomonitoring or exposure modeling may be used. Biomonitoring methods include the measurement of urinary or serum levels in a representative study population. Exposure modeling requires the estimation of released chemical quantities, pathways and transformation or degradation mechanisms (van Leeuwen and Vermeire 2007). In the area of food contact materials (FCMs), exposure models often combine dietary surveys, with packaging market distributions and migration data. A recent model based on this approach is the Flavours, Additives, and food Contact materials Exposure Tool (FACET, Oldring et al. 2013). Waste water treatment plant (WWTP) monitoring has also been suggested as a proxy for human chemical exposure (Venkatesan and Halden 2014) and was previously used to estimate perfluorinated chemical (PFC) exposure (D’eon et al. 2009).
Risk assessment
In this final step, the risk assessors integrate the information collected during the previous steps to quantify the actual probability, “the risk,” of a harmful effect occurring in an exposed population (risk quotient, van Leeuwen and Vermeire 2007). Additional information regarding the assumptions and uncertainties involved in the prior steps is included. Risk characterization may distinguish between sex, age, lifestyle, and/or ethnic groups to allow for a more differentiated understanding of a chemical’s risk to cause harm within a population. Risk characterization should adhere to the principles of transparency, clarity, consistency, and reasonableness (TCCR, EPA 2014).
3. Risk assessment agencies in Europe and the U.S.
In Europe, risk assessment is formally separated from risk management. While the European Food Safety Authority (EFSA) is in charge of carrying out the science-based risk assessment of FCMs, the European Commission, in particular the Directorate-General for Consumer Health (DG SANCO), the European Parliament, and the EU Member States are charged with the integration of scientific evaluation of risk with political, economic, social, and environmental considerations (EFSA 2014). In the U.S., the Food and Drug Administration (FDA) carries out both risk assessment and risk management. Both in the U.S. and in Europe, the risk arising from substances not specifically regulated or exempted from regulation must also be assessed independently by manufacturers.
4. Criticism
- Not always a clear distinction between the “subjective” risk management and the “objective” risk assessment, risk assessment also requires normative decisions (van Leeuwen and Vermeire 2007)
- No clearly defined “acceptable risk” for population exposures and non-cancer health effects (Martin et al. 2013)
- Standard safety factors are somewhat arbitrarily set and do not always represent worst case scenarios (Falk-Filipsson et al. 2007, Hasegawa et al. 2010, Martin et al. 2013)
- Dose-response assessment does not always sufficiently cover low dose risks (actual exposures) (Crump 2003)
- Models used in dose-response assessment are not scientifically founded (dichotomy of linear and non-linear mechanisms, low-dose effects (Crump 2003)
- Commonly sized in vivo studies can only detect risk levels (the risk of developing a certain disease endpoint) above 1% frequency in rodent populations, environmental risk levels of regulatory interest are often much lower (e.g. 1 in 100,000) (Crump 2003)
- Information on release, pathways and transformation or degradation mechanisms, human exposure as well as human metabolism of chemicals is often incomplete and sometimes associated with large uncertainties (van Leeuwen and Vermeire 2007)
- Risk does not always increase with increasing exposure (non-monotonic dose-response curves for hormone mimicking chemicals, Zoeller et al. 2012)
- Not all uncertainty is quantifiable (meaning that a “risk” can be calculated), remaining uncertainty can be qualitative and not quantifiable (Bradley and Drechsler, 2013)
5. References
Bradley, R. and Drechsler, M. (2013). “Types of Uncertainty.” Erkenntnis, 1-24.
D’Eon, J.C., et al. (2009). “Observation of a commercial fluorinated material, the polyfluoroalkyl phosphoric acid diesters, in human sera, wastewater treatment plant sludge, and paper fibers.“ Environ Sci Technol 43:4589-4594.
EFSA (2014). “About EFSA.” Retrieved January 29, 2014 from the web page of the European Food Safety Authority.
EPA (2005). “Guidelines for carcinogen risk assessment – EPA/630/P-03/001F.” Retrieved February 11, 2014 from the web page of the US EPA.
EPA (2014). “EPA risk assessment.” Retrieved January 29, 2014 from the web page of the U.S. EPA.
Falk-Filipsson et al. (2007). “Assessment factors—Applications in health risk assessment of chemicals.” Environmental Research 104, 108–127
Goldman, L.R. and Koduru, S. “Chemicals in the environment and developmental toxicity to children: a public health and policy perspective.” Environmental Health Perspectives 108(Suppl 3): 443–448.
Hasegawa, et al. (2010). “Proposal of new uncertainty factor application to derive tolerable daily intake.” Regulatory Toxicology and Pharmacology 58, 237–242.
Martin, O. et al. (2013). “Dispelling urban myths about default uncertainty factors in chemical risk assessment –sufficient protection against mixture effects?”. Environmental Health 12:53.
NRC (National Research Council, 1983). “Risk assessment in the federal government:managing the process.” National Academy Press, Washinton, DC. US.
Oldring, P. et al. (2013). “Development of new modeling tool (FACET) to assess exposure to chemical migrants from food packaging.” Food Additives & Contaminants: Part A.
Venkatesan, A. and Halden, R. (2014). “Wastewater Treatment Plants as Chemical Observatories to Forecast Ecological and Human Health Risks of Manmade Chemicals.” Scientific Reports 4.
Van Leeuwen, C.J. and Vermeire, T.G. (2007). “Part I. Introduction” in Risk assessment of chemicals: an introduction. 2nd edition.” Springer.
Zoeller, T. et al. (2012). “Endocrine-Disrupting Chemicals and Public Health Protection: A Statement of Principles from The Endocrine Society.” Endocrinology 153, 9.
* May be broken down into one safety factor for intra-species variability (factor of 10, aims to account for differences between rodents and humans) and one for inter-species variability (also a factor of 10, animals used for in vivo studies are highly inbred and thus have a very homogenous genetic background which does not reflect natural genetic variability) (Renwick 1991)